ABSTRACT
The need to protect computer networks from unknown attacks has influenced various works to develop and implement new methods to classify network connections, such as intrusion detection systems (IDS). Therefore, the purpose of this work is to compare the effectiveness of different multivariate analysis methods with software implementations of network intrusion detection systems (NIDS) and to propose a new NIDS model that improves protection against unknown attacks.
The DARPA1998 dataset was used as a sample of a network under attack, and Snort software was used as a point of comparison for different methods tested. The performance of multivariate adaptive regression splines, support vector machine, and linear discriminant analysis was measured through a ROC curve, using the kdd99 derived dataset, showing that its accuracy exceeds the one that is achieved by the Snort software that uses rule-based detection.
RESUMEN
La necesidad de proteger redes computacionales de ataques desconocidos, ha influenciado una variedad de trabajos que apuntan al desarrollo e implementación de nuevos métodos para clasificar conexiones de red como son los sistemas de detección de intrusos (IDS). La finalidad de este trabajo, en el ámbito de los IDS, es comparar la efectividad de distintos métodos de análisis multivariante con implementaciones en software de sistemas de detección de intrusos en redes (NIDS) y proponer un nuevo modelo de NIDS que mejore la protección contra ataques desconocidos. Se utilizó el conjunto de datos DARPA1998 como muestra de una red bajo ataque, y se utilizó el software Snort como punto de comparación para los distintos métodos puestos a prueba. Se midió el rendimiento de tres métodos de análisis multivariante (multivariate adaptive regression splines, support vector machine y linear discriminant analysis) por medio de una curva ROC, utilizando el conjunto de datos derivados kdd99, mostrando que su precisión supera la alcanzada por el software Snort que utiliza detección basada en reglas.
INTRODUCTION
Protected computer networks and free from intruders is a need growing in combination with the expansion of information technologies, both in everyday life and in productive tasks. The Internet of Things (“Internet of Things”) has enabled the development of new systems such as Industry 4.0 or smart cities but has exposed networks to potential intruders who can exploit vulnerabilities in new devices and communication protocols (Otoum & Nayak, 2021). One answer to security breaches is intrusion detection systems or IDS (“…expert system capable of detecting intrusions, penetrations or other types of computational abuse.” Denning, 1987), which are the main object of research of this work.
IDSs can be classified according to the attack detection methodology into rule-based or prior knowledge-based, behavioral or anomaly-based, and protocol or specification-based methodologies.
Rule-based detection systems have been widely considered more reliable than the others because they work based on pre-established rules designed from known vulnerabilities, which in theory reduces the number of false positives when evaluating network traffic. However, the capacity demonstrated by unknown attacks (“0-day”) to infect a massive number of computers in a short time makes it increasingly necessary to use and develop expert systems capable of adapting to unknown attacks quickly.
On the other hand, Anomaly-based systems can detect unknown attacks but with a high false-positive rate. Finally, protocol-based methods see changes in network state but are resource-intensive and inefficient against attacks using protocols known to be secure (Liao et al., 2013).
Machine learning-based data analysis methods have been on the rise in recent years, and they can be used to improve anomalous or behavior-based detection methods by reinforcing new technologies such as agent systems (Perháč, Novitzká, Steingartner, & Bilanová, 2021). For this reason, this work focuses on evaluating the prediction performance (Sabahi & Movaghar, 2008) of the two main types of IDS (anomalies and rules) by measuring false positives, true positives, and a ROC curve of the results obtained by different intrusion detection methods.
This paper proposes three anomaly detection methods with a high degree of efficiency: Support Vector Machine (SVM), Multivariate Adaptive Regression Splines (MARS), and Discriminant Analysis (LDA) (Abraham et al., 2004). These methods are compared with the rule-based detection methodology using Snort software (Roesch, 1999). The tests were done with the DARPA 1998 intrusion dataset (Lincoln Laboratory, 1998-2000) and its derived dataset kdd99 (FICKD, 1999).
The structure of this paper consists of a section of materials and methods explaining the test data and metrics used. This is followed by a section on methods under study where the methods used are explained. The Methodology section explains the tests performed, where the results are presented in section five, called results. Section seven discusses and proposes an IDS method based on the results. Finally, the concluding section of this article proposes future initiatives for continued work on IDS systems.
2. MATERIALS AND METHODS
2.1 Types of attacks
It is possible to identify different types of attacks in a network where the most common are the following (Sharma and Gupta, 2015; Kumar and Venugopalan, 2017):
– Denial of Service (DOS): This type of attack focuses on preventing communication between a server and its clients, either temporarily or indefinitely, mainly through an overload of requests to the target server to exhaust all its resources. It’s a type of attack that can be quite evident when reviewing network traffic as the number of connections increases greatly. However, it is very difficult to detect by means of rule-based detection systems since most attacks use legitimate characteristics of the protocols to achieve their objective, as is the case of the Neptune attack (SYN Flood) present in this dataset. It’s possible to stop some of these attacks by limiting the number of packets per second accepted by the network, but this can lead to undesirable performance reductions.
– Remote to Local (R2L): This attack is executed when the attacker does not have formal access to the target computer. In this case, the attacker can only send packets over the network to exploit a vulnerability in the system or user and gain remote access. The attack versions that are easiest to detect through rule-based systems use vulnerabilities within the system running on the target machine since once they are discovered, only the construction of a rule is required to detect them. However, attacks that start from social engineering are also widespread, exploiting the vulnerabilities of the user himself (deceiving him) to deliver the information required by the attacker, for example, the password of a user account. The ultimate goal of this type of attack is to obtain administrator privileges inside the compromised computer, which can take several days to make it difficult to detect them. According to the tested dataset, an attack can start with an R2L attack one day, followed by a “User to Root” attack the next week to avoid temporal correlation between both processes to obtain administrator privileges.
– User to Root (U2R): This type of attack begins when the attacker already has access to a user account within the target computer. The attacker uses some vulnerability within the system to gain administrator privileges. The most common vulnerabilities to scale a user’s rights use a buffer overload in an application or use environment variables and temporary files. The common feature for this type of attack within the data set used is the creation of a remote terminal with administrator privileges at the end of the process.
– Probing: This type of attack commonly starts a sequence of attacks to scan and discover computers types on the network and running services. The attacker wants to know services and the operating system versions. The riskiest aspect of this attack is that it can be carried out against several computers quickly.
2.2. Test Data
The data for testing is DARPA1998 and KDD99, which are still used to simulate attacks with modern systems such as networks with IoT (Otoum & Nayak, 2021), and their most important characteristics are:
– DARPA 1998: This dataset is still widely used for testing on IDS (Erdem, 2016), and although they have been criticized for the little information that exists regarding the correct simulation of network environment (McHugh, 2000) there are studies that state that “if a modern intrusion detection system is not able to classify with good performance the DARPA 1998 dataset, then it has no chance of doing so in a real environment” (Mahoney & Chan, 2003). This set is distributed via a web page in the form of “.pcap” files. The original data were created in a simulated network environment for 7 weeks, in which 38 different types of attacks were tested, which can be grouped into the following 4 families.
– KDD99: This dataset was created for the “Third International Knowledge Discovery and Data Mining Tools Competition”, a competition whose objective was to build a network intrusion detector that could classify connections into two types: “good” or common connections and “bad” connections or attacks. It consists of 41 features defined as the most important for distinguishing between normal connections and attacks (Stolfo et al. 1999), which are derived from the 1998 DARPA dataset. This set was mainly used for testing detection methods based on multivariate analysis techniques.
2.3. ROC curve
A network usually transmits a constant flow of thousands of harmless packets, and only a few malicious packets are required to carry out an attack. This unbalanced packet’s classes can create IDS classifiers with 99% accuracy for harmless packages, which is useless to detect attacks.
For this reason, a ROC curve plot can measure the performance of an IDS (Durst R, 1999), which is created by plotting true positive ratio (TPR) versus false positive ratio (FPR) at different discrimination thresholds.
The ROC curve (Figure 1) has the advantage of being insensitive to class distribution, and even if the proportion of positive and negative instances changes, the ROC curve will remain the same.
The closer the curve is to the upper left corner of the graph, the greater the detection capacity of the IDS. On the other hand, the closer the curve is to the center, the more random the model’s prediction.
Figure 1. Example ROC curve for different intrusion detection techniques.
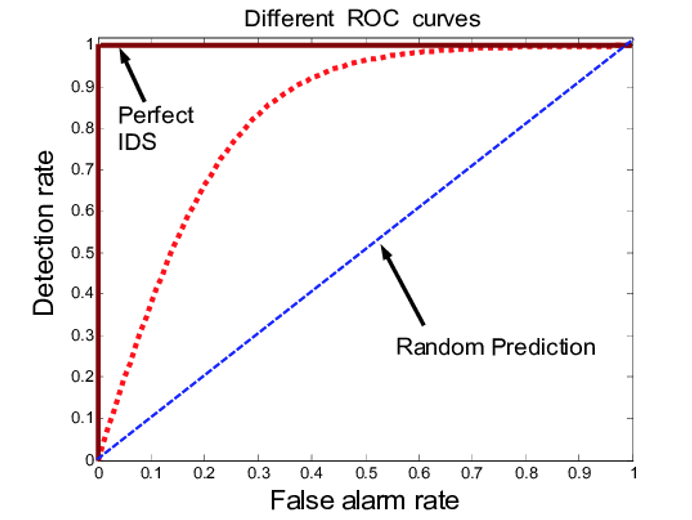
Source: Sabahi & Movaghar (2008)
2.4. Intrusion Detection System
For some time now, several works have been oriented towards the construction or extension of IDSs that use more advanced anomaly detection techniques. For example, in the area of open-source software development, there are works regarding Snort (Saganowski, 2013), (Gómez et al. 2009), and also works regarding Bro (Mantere et al. 2013), (Mantere et al. 2014). In addition, there are already IDSs focused on helping researchers evaluate new anomaly detection methods such as Hogzilla (Angelo, 2016). In contrast, commercial IDS systems have demonstrated great effectiveness, as is the case of Darktrace (Darktrace, 2021). The most advanced works have focused on joining different detection methods by anomalies because it can reach more than 99% effectiveness in classification (Mukkamalaa et al., 2005). However, these systems still have several limitations to detect new attacks due to the overfitting generated by training IDS with all the attack data and potential biases from rule-based methods (Mehmood et al., 2021).
3. TECHNIQUES ON STUDY
3.1 Multivariate Adaptive Regression Splines (MARS)
A regression model adds basis functions for prediction, characterized by splines that allow better curve fitting than linear regression. The function defines it:
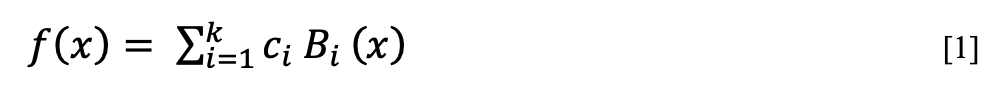
Source: Friedman (1991)
The model generated in [1] is a weighted summation of base functions Bi (x), each ci being a constant coefficient, and in turn, each basis function Bi (x), can take three different values:
- A constant, there is only one, which is the intercept.
- A pivot function, which take the form max (0, x-const) or max (0, const-x).
- A product of two or more pivot functions can model the interaction of two or more variables.
Pivot Functions
The pivot functions are a key part of MARS model and are defined by the following formula:

Where c is a constant called node, which indicates the node point where the function changes direction. The node functions are found from two significant model building steps:
Step forward (forward pass)
The algorithm starts with a model consisting only of the intercept, the mean of response values.
Then, pairs of base functions are repeatedly generated and added to the model. A couple of basis functions that achieve the largest reduction in residual squared errors is found at each step. Each new basis function consists of a term within the model, which could be the intercept multiplied by a new pivot function. A variable and one node define a pivot function to add a new basis function. MARS must search for all combinations of:
- Existing terms
- All variables (for selecting a new base function)
- All values of each variable (for the node in the new pivot function)
To calculate the coefficient of each term, MARS applies a linear regression on the terms.
The process of adding terms continues until the change in residual squared error is too low to continue or until the largest number of terms defined by the user at the time of starting model construction is reached.
Step backward (backward pass)
The forward step usually generates an overfitted model that does not work well with general data. Backward stepping removes nodes from the model to build a model that works with any data set. Nodes are removed one by one to find the least effective term at each step until a model is found that allows a good fit to the overall data.
While the forward step adds terms in pairs, the backward step often removes one side of the pair, and thus the resulting terms are not always seen in pairs.
3.2 Support Vector Machine (SVM)
SVMs are a supervised learning model in which the model is first built from training data to classify new data in a binary fashion.
The linear kernel version of this model constructs one or more “hyperplanes” within a many-dimensional space. It is assumed that there is a “hyperplane” within an F-dimensional space capable of separating data into two groups linearly.
The training of an SVM can be defined according to (Vapnik, 2013) as a quadratic optimization problem as follows:
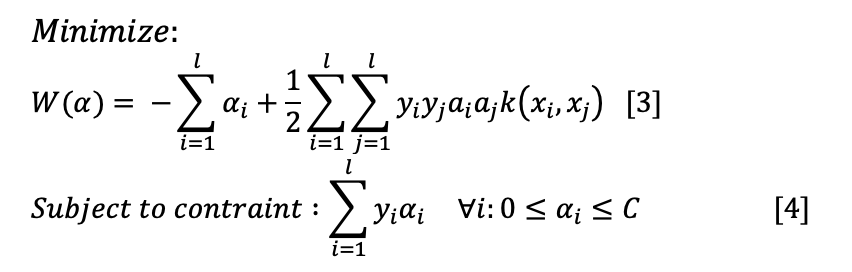
Where l is the number of training samples, α is a vector of l variables, and each component of αi corresponds to a training sample (xi, xj). The solution of (3) being the vector α* for which (3) is minimized and (4) is satisfied.
When a linear solution for a classification problem is not possible, the “kernel function” k (xi, xj) can be changed for non-linear functions such as Polynomial homogeneous, Polynomial non-homogeneous, Radial, and Hyperbolic.
3.3. Linear Discriminant Analysis (LDA)
LDA is used in statistics, pattern recognition, and machine learning to find a linear combination of features that can identify or separate two or more classes of objects or events. The resulting combination can be used as a linear classifier.
LDA considers a set of observations x or characteristics for each sample of an object or event with a known class y ∈ {0,1}, which is called the practice set. The classification problem is to find a good predictor for the class y from any sample of the same distribution, which is not necessarily from the practice set, only having one observation x.
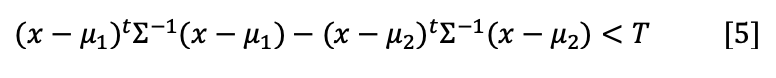
LDA approaches the problem by assuming that conditional probability density functions p(x│y=1) and p(x│y=2) are both normally distributed with mean and covariance (μ1, Σ1) and (μ2, Σ2) respectively. Under this assumption, the Bayes optimal solution resulting in a QDA (Quadratic Discrimination Analysis) classifier is found. Then, when Σ1 = Σ2 = Σ, the expression of the LDA function is obtained:
3.4. Snort Software
Snort is an open-source intrusion prevention system (IPS) developed by Cisco. It is capable of performing real-time traffic analysis and packet logging within IP networks.
It can perform protocol analysis, content search, and comparison and detect various attacks and eavesdropping.
Snort can be used either as a simple packet sniffer like TCP dump, a packet logger (useful for debugging network traffic), or a full intrusion prevention system.
Snort’s detection system is rule-based, which compares these rules with received packets to detect if these packets violate any rules and therefore should be blocked or if they are normal network traffic. Snort rules follow the structure shown in Figure 2.
Rule Header with following options:
- alert (action to take): This field tells Snort what to do when it encounters a packet matching the rule’s criteria (usually an alert).
- TCP (protocol): Specifies the protocol of the packet. Snort currently supports TCP, UDP, ICMP, and IP.
- $EXTERNAL_NET: Source address.
- $HTTPS_PORTS: Source port.
- -> (address operator): Indicates the direction of traffic.
- $HOME_NET: Destination address.
- Any: destination port.
Figure 2. Example Snort rule structure
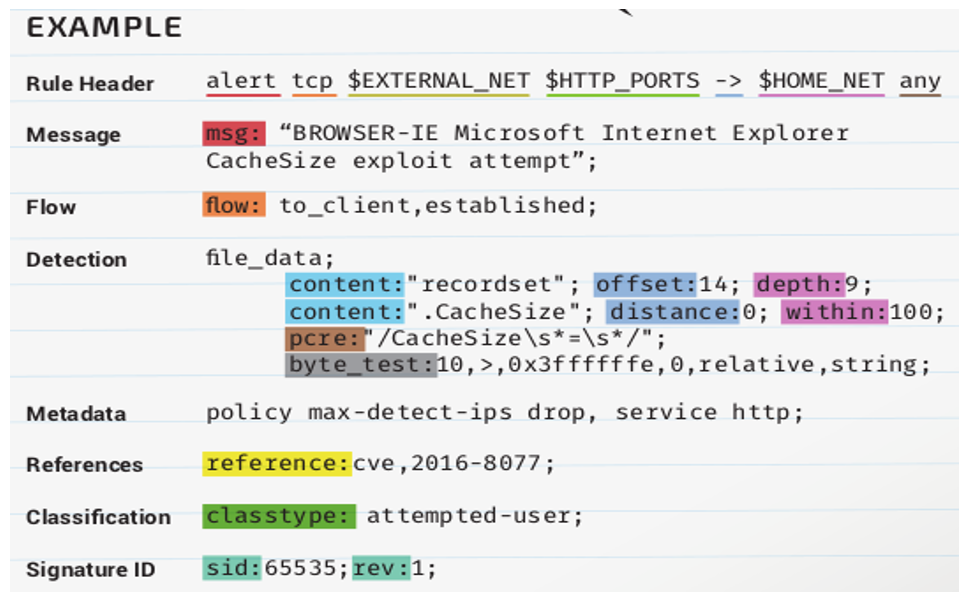
Source: Cisco (2016)
Following the header, rules specify how to check the packet for content that may indicate an attack.
Figure 3 shows the data flow in Snort components. First, traffic is collected from the network via libpcap. Packets must pass through a series of decoding routines to be accepted on ports such as TCP and UDP. The packets are then sent through a registered set of preprocessors. Each preprocessor checks the packet to see if it should be parsed. The packets are then sent to the detection engine. The detection engine reviews each packet against each option selected in Snort configuration files.
Figure 3. Data flow in Snort components
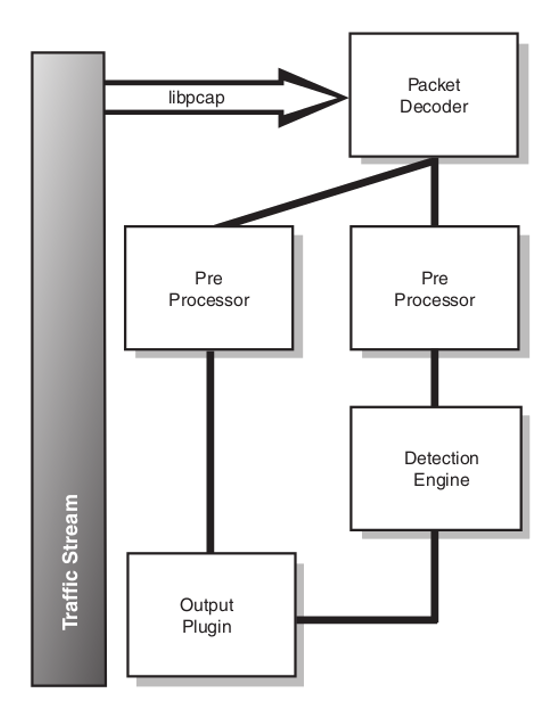
Source: Koziol (2003)
4. METHODOLOGY
The performance of different chosen methods was evaluated using the DARPA and KDD99 datasets to classify into two classes, the first of standard connections and the second of malicious connections.
The MARS, SVM, and LDA methods were used to classify the kdd99 dataset. Firstly, a dataset of 494,021 connections trained the models, and this dataset contained 97,278 normal connections and 396,743 malicious connections or attacks. Then, the models classified connections from the test group, which corresponds to 10% of the last two weeks of testing the DARPA 1998 set.
Snort software was used to classify the data from the last two weeks of the DARPA 1998 test set. This dataset corresponds to 10 files with 1,540,482 connections, composed of 660,044 normal and 880,438 malicious connections.
4.1. MARS Experiment
The MARS experiment used the R programming language’s ‘earth’ package (Milborrow et al., 2017). The model was constructed with the glm option, a binomial distribution, and a third maximum level of interaction o degree.
This model assumed a time complexity close to O(m*n*log(n)), where m is the number of samples and n number of features. The model is an improved version of the CART (classification trees) algorithm and uses the same two main functions (Friedman, 1991).
The time complexity of the model at the time of classification is linear since it is only necessary to replace the variables in each pivot function, which increases with the dimensionality of the data.
4.2. SVM Experiment
The SVM experiment used the R programming language’s ‘e1071’ package (Meyer et al., 2017).
A model with a “linear kernel” was built, with a cost equal to 0.1 and gamma equal to 0.00862069, obtaining 71,406 vectors in total.
This method is the one with the most significant temporal complexity for its construction, which varies between O (n2) and O (n3) depending on the cost chosen (Bottou & Lin, 2006).
4.3. LDA Experiment
The construction of the model was developed similar to the previous models with the R programming language.
Since this model has a space complexity of O(mn+mt+nt), with t = min(m,n) (Cai, He, & Han, 2008), which means a complexity O(nm), it was impossible with the available resources to build the model with all the features.
As for its time complexity for the construction, this algorithm has a complexity of O(mnt+t3 ), which gives us a time complexity of O(mn2). Finally, we reduced the data dimensionality by eliminating variables with a variance close to zero, leaving 16 variables for the construction of the model.
4.4. Snort Experiment
The Snort software inspected pcap’s capture files and classified DARPA 1998 dataset. The software was loaded with default rules in version 2.9.6. After running the classification, a script was used to verify the date of records with a list of labeled connections to count the false positives and true positives.
We ignored alerts for the use of SNMPv1 and SNMPv2 protocols (“SNMP public access UDP” and “SNMP request UDP”) because the simple use of these protocols was not considered a security threat when the dataset was created.
It was also necessary to adjust the “$HOME” variable in the Snort configuration file to reflect the simulated network structure in the dataset and achieve better accuracy regarding DoS attacks.
5. RESULTS
5.1. Snort
Table 1 illustrates that Snort failed to detect certain types of attacks. DoS attacks show a greater intensity during Tuesday 1, Friday 1, and Thursday 2. These are of the Neptune or SYN Flood type that uses a legitimate property of protocol to cause server resources to be exhausted
Table 1. Snort test results
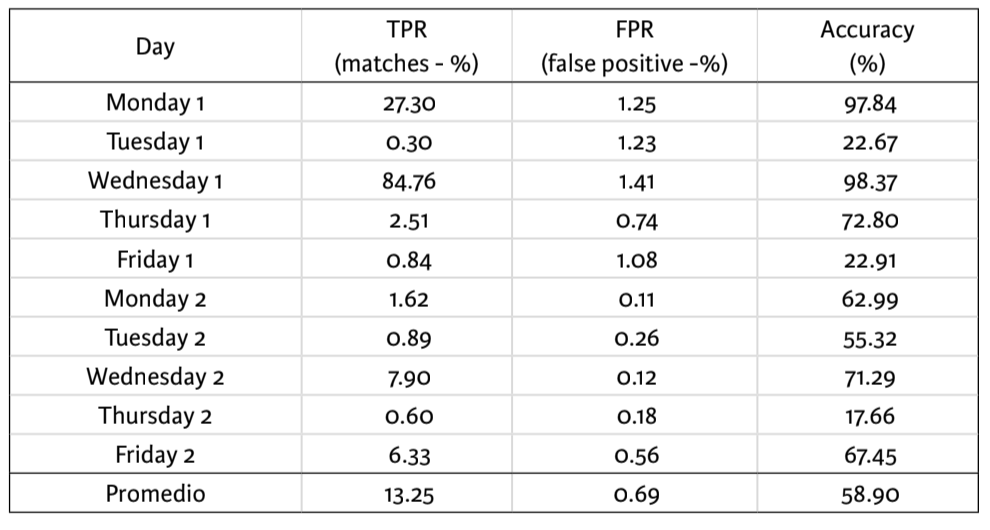
Source: Prepared by the authors.
This is a common shortcoming of rule-based detection techniques, which do not have a rate limit for packet transmission.
Another cause of inaccuracy, especially on Wednesday 1, Friday 1, Monday 2, Wednesday 2, Thursday 2, and Friday 2, are SNMP attacks (snmpguess and snmpgetattack). Snort probably did not generate an alert since an alert is sent simply because a vulnerable protocol is used. It was decided not to ignore these alerts because the SNMP protocol in its version 1 and 2 is vulnerable by default. An IDS must be actively alert to discern whether the network is under an effective attack or whether it may only be vulnerable to a future attack.
Tuesday second was focused on network scanning attacks, and Snort only detected scans coming from nmap during ten days of testing.
Although Snort achieved a low accuracy during tests, it is essential to remember that accuracy calculation is highly controlled by the percentage of presence of each group in the sample. Snort obtained a higher accuracy in days with fewer attacks or attacks with fewer packets than in days of attacks with more packets. This may indicate that Snort was designed to reduce the number of false positives to a minimum.
Snort is a discrete classifier, and it is impossible to construct a ROC curve plot with its results. However, the following formula can calculate the area under the curve with the TPR and FPR indicators.

5.2. Anomaly detection methods
Figure 4 illustrates that the three selected methods for intrusion detection by anomalies showed very good results. They obtained an accuracy higher to 92% and area greater than 94% (Table 2), and they showed a better classification than Snort on the data set.
The results indicate that the SVM method achieves a wider area under the curve, but the MARS and LDA models have an area under the curve quite close. Additionally, the LDA method performs well despite the construction with fewer variables than the other two methods.
Figure 4. ROC curve anomaly detection models
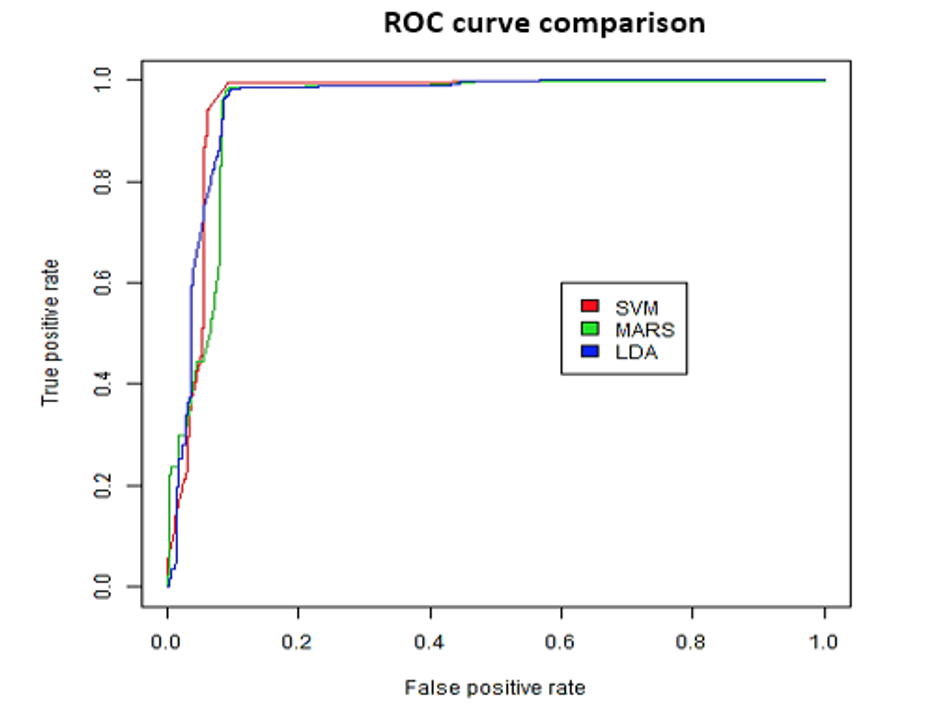
Source: Prepared by the authors.
Table 2. Summary of detection techniques.
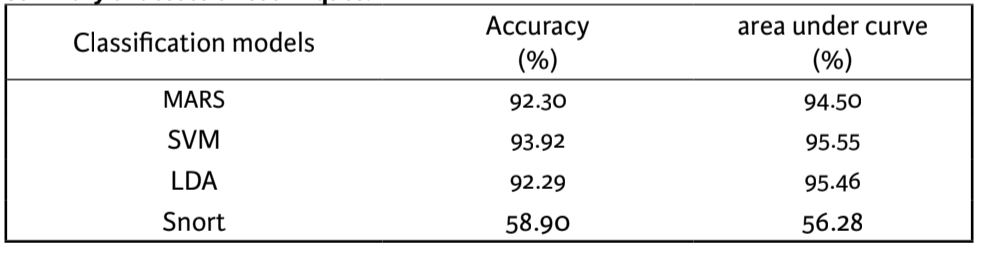
Source: Prepared by the authors.
6. IDS PROPOSAL
The results suggest that a system based on anomaly detection, with any of these three methods, could improve the performance of a system based on standard rules or general-purpose IDS systems.
For this reason, we propose developing an IDS based entirely on anomaly detection using three previously tested methods since they have proven to be effective in detecting malicious connections.
The first choice to pay attention to is to choose a learning process for the models applied to the IDS. Although it is possible to implement incremental models and some of the models used already have software implementations, incremental learning algorithms can be susceptible to attacks of the “adversarial examples” type (Huang et al., 2017). This type of attack sends information created by the attacker to change the model’s parameters little by little until the model loses its ability to classify connections correctly. It can also attack the machine architecture itself, such as specter attacks (Schwarz et al. 2018).
Therefore, Figure 5 proposes a model that can periodically rebuild its database, considering as a technique distributed processing for cases such as SVM model.
Figure 5. Predictive model and database
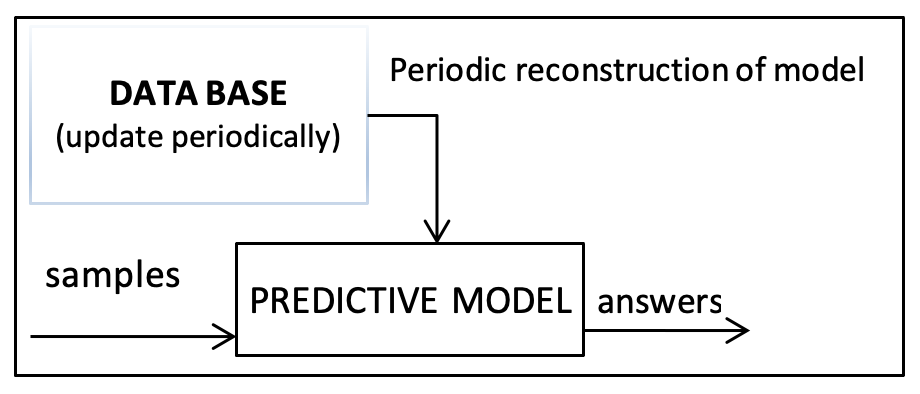
Source: Prepared by the authors.
Figure 6 shows that the system can rebuild this model to reflect new attacks or the network to which it must be adapted to then send the network samples to the three predictive models that will classify the connections.
Figure 6. Predictive model operation
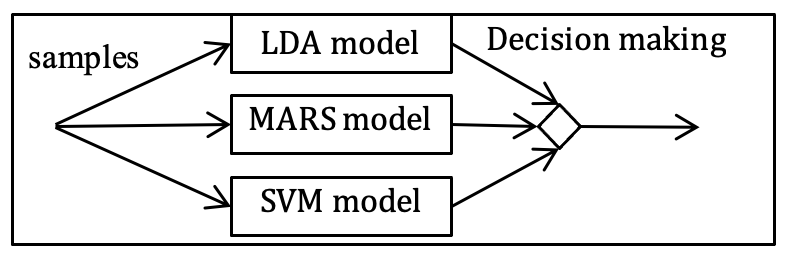
Source: Prepared by the authors.
The samples will be created in the first instance having the same 41 derived characteristics that are used in the kdd9 dataset. This process can be done with programs such as tcptrace or Hogzilla, although both will require development to obtain all required characteristics.
Likewise, obtaining the data from the network can be carried out either through libraries such as libpcap or higher-level programs such as Snort or Hogzilla (both use libpcap for the capture).
7. CONCLUSIONS AND FUTURE WORK
Rule-based detection methods depend to a large extent on the network administrator’s knowledge of the protocols used and systems to be defended. It is not uncommon nowadays to use legacy systems, even in critical services for specific countries. A rule-based system that is constantly updated does not necessarily mean good security as there may be deactivated rules because they are not considered necessary for updated systems.
The increasing use of IoT networks highlights the development of new methods that improve the system’s security through intelligent networks based on expert systems to detect and block intruders.
Thus, the implementation of an effective IDS in a network does not depend so much on the expertise of the person in charge of configuring it, but on the system’s ability to adapt and identify unusual traffic in the network.
As for future work, it is necessary to take into consideration factors such as the following:
- The Snort software probably had problems detecting attacks because the used dataset is old. The rules loaded by default for Snort 2.9.6 may protect networks with more up-to-date systems and communicate with much newer protocols.
- Comparative tests with much more up-to-date datasets such as CTU-13 (Garcia et al. 2014), ISCXIDS2012 (Shiravi et al. 2012), or CICIDS2017 (Sharafaldin et al. 2018) need to be conducted to verify whether derived features used in the present work serve to an equal extent to characterize current attacks.
- Implement and test the proposed model for effectiveness and efficiency since this work did not focus on studying the efficiency of anomaly detection methods because the data flow is high volume in today’s networks. Finally, these models are proposed using agent models that can monitor network services in intelligent systems, along with other services in the network (Fuentealba et al., 2017).
REFERENCES
Abraham, A., Sung, A., Mukkamala, S., & Ramos, V. (2004). Intrusion detection systems using adaptative regression splines. Enterprise Information Systems VI, 211-218.
Angelo, P. (2016). Hogzilla IDS: http://ids-hogzilla.org/
Bottou, L., & Lin, C.-J. (2006). Support Vector Machine Solvers.
Cai, D., He, X., & Han, J. (2008). Training Linear Discriminant Analysis in Linear Time. Data Engineering, 2008. ICDE 2008. IEEE 24th International Conference on. Cancun, Mexico: IEEE.
(2016). Snort Rule Infographic. Snort Software, https://snort.org/documents/snort-rule-infographic
Darktrace (2021). Darktrace Immune System Self-Learning Detection & Response. White Paper. Darktrace Limited, Cambridge, UK. https://www.darktrace.com/en/resources/wp-platform.pdf (Access: october 20, 2021).
Denning, D. E. (1987). An Intrusion-Detection Model. IEEE Transactions on Software Engineering – Special issue on computer security and privacy, 222-232.
Durst R, C. T. (1999). Testing and evaluating computer intrusion detection systems. Commun ACM., 42(7):53–61.
Erdem, H. &. (2016). A review of KDD99 dataset usage in intrusion detection and machine learning between 2010 and 2015. PeerJ PrePrints., 4, e1954. https://www.researchgate.net/publication/309038723_A_review_of_KDD99_dataset_usage_in_intrusion_detection_and_machine_learning_between_2010_and_2015
FICKD (1999 ). KDD Cup 1999 Data, Fifth International Conference on Knowledge Discovery, 28 de Octubre de 1999. http://kdd.ics.uci.edu/databases/kddcup99/kddcup99.html
Friedman, J. H. (1991). Multivariate Adaptive Regression Splines. Annals of Statistics, 19, 1-141.
Fuentealba, D., Soto, I., Liu, K., & Martinez, A. J. (2017). Tracking system with VLC for underground mine using multi-agent systems. 2017 First South American Colloquium on Visible Light Communications (SACVLC) (pág. 5). Santiago: IEEE.
Garcia, S., Grill, M., Stiborek, H., & Zunino, A. (2014). An empirical comparison of botnet detection methods. Computers and Security Journal, 15, 100-123. https://doi.org/10.1016/j.cose.2014.05.011
Gómez, J., Gil, C., Padilla, N., Baños, R., & Jiménez, C. (2009). Design of a Snort-Based Hybrid Intrusion Detection System. En O. S. (eds), Lecture Notes in Computer Science, vol 5518. (págs. 515-522). Berlin, Heidelberg: Springer.
Huang, S., Papernot, N., Goodfellow, I., Duan, Y., & Abbeel, P. (2017). Adversarial Attacks on Neural Network Policies, Feb.8, 2017. arXiv:1702.02284 [cs.LG].
Koziol, J. (2003). Intrusion Detection with Snort. Pearson Technology Group.
Kumar, D. Ashok and Venugopalan, S. R. (2017). Intrusion Detection Systems: A Review. International Journal of Advanced Research in Computer Science, Volume 8, No. 8, September-October 2017, IJARCS. file:///C:/Users/osema/Downloads/4703-10013-1-PB.pdf
Liao, H.-J., Lin, C.-H. R., Lin, Y.-C., & Tung, K.-Y. (2013). Intrusion detection system: A comprehensive review. Journal of Network and Computer Applications, 36(1), 16-24, Jan., 2013. https://profsandhu.com/cs5323_s17/ids2013.pdf
Lincoln Laboratory (1998-2000). Massachusetts Institute of Technology (MIT). https://www.ll.mit.edu/ideval/index.html
Mahoney, M. V., & Chan, P. K. (2003). An analysis of the 1999 DARPA /Lincoln Library evaluation data for network anomaly dtection. Technical Report CS-2003-02.
Mantere, M., Sailio, M., & Noponen, S. (2013). Network Traffic Features for Anomaly Detection in Specific Industrial Control System Network. Future Internet, 5, 460-473.
Mantere, M., Sailio, M., & Noponen, S. (2014). A module for anomaly detection in ICS networks. HiCoNS ’14 Proceedings of the 3rd international conference on High confidence networked systems (págs. 49-56 ). Berlin, Germany: Association for Computing Machinery.
McHugh, J. (2000). Testing Intrusion Detection Systems: A Critique of the 1998 and 1999 DARPA IDS evaluations. ACM Transactions on Information and System Securit, 3(4):262-294, Noviembre de 2000. https://www.researchgate.net/publication/220593622_Testing_Intrusion_Detection_Systems_A_Critique_of_the_1998_and_1999_DARPA_Intrusion_Detection_System_Evaluations_as_Performed_by_Lincoln_Laboratory
Mehmood, M., Javed, T., Nebhen, J., Abbas, S., Abid, R., Bojja, G. R., & Rizwan, M. (2021). A hybrid approach for network intrusion detection. Computers, Materials and Continua, 91-107.
Meyer, D., Dimitriadou, E., Hornik, K., Wingessel, A., & Leisch, F. (Feb. 2, 2017). Package ‘e1071’. CRAN R-project. https://cran.r-project.org/web/packages/e1071/e1071.pdf
Milborrow, S., Tibshirani, R., & Lumley’, T. (2017). Package ‘earth’. July 28, 2017. CRAN R-project: https://cran.r-project.org/web/packages/earth/earth.pdf
Mukkamalaa, S., Sung, A. H., & Abraham, A. (2005). Intrusion detection using an ensemble of intelligent paradigms. Journal of Network and Computer Applications, 167–182. http://ngwsp.softcomputing.net/jnca2.pdf
Otoum , Y., & Nayak, A. (2021). AS-IDS: Anomaly and Signature Based IDS for the Internet of Things. Journal of Network and Systems Management, 1-26.
Perháč, J., Novitzká, V., Steingartner, W., & Bilanová, Z. (2021). Formal model of IDS based on BDI logic. Mathematics, 2290.
Roesch, M. (1999). SNORT- Lightweight intrusion detection for networks. Proceedings of LISA ’99: 13th Systems Administration Conference. Seattle, Washington.
Sabahi, F., & Movaghar, A. (2008). Intrusion Detection: A Survey. Third International Conference on Systems and Networks Communications (pp. 23-26). Sliema: IEEE.
Saganowski Ł., G. M. (2013). Anomaly Detection Preprocessor for SNORT IDS System. En Advances in Intelligent Systems and Computing, vol 184. (pp. 225-232). Springer, Berlin, Heidelberg.
Schwarz, M., Schwarzl, M., Lipp, M., & Gruss, D. (2018). NetSpectre: Read Arbitrary Memory over Network, Jul., 2018. Graz, Estiria, Austria. https://arxiv.org/pdf/1807.10535.pdf
Sharafaldin, I., Lashkari, A. H., & Ghorbani, A. A. (2018). Toward Generating a New Intrusion Detection Dataset and Intrusion Traffic Characterization. 4th International Conference on Information Systems Security and Privacy (ICISSP). doi:10.5220/0006639801080116, https://pdfs.semanticscholar.org/2342/9b5be933e16e6988da9a322ad95dfdc8c4b0.pdf?_ga=2.151631353.1155792653.1634831662-690506284.1634831662
Sharma, S. and Gupta, R. K. (2015). Intrusion detection system: A review. International Journal of Security and its Applications, 69-75. https://www.ijert.org/research/intrusion-detection-system-a-review-IJERTCONV8IS10020.pdf
Shiravi, A., Shiravi, H., Tavallaee, M., & Ghorbani, A. A. (2012). Toward developing a systematic approach to generate benchmark datasets for intrusion detection. Computers and Security, 31, 357–374.
Stolfo, S., Fan, W., Lee, W., Prodromidis, A., & Chan, P. (1999). Cost-based Modeling and Evaluation for Data Mining With Application to Fraud and Intrusion Detection: Results from the JAM Project. Proceedings of the 2000 DARPA Information Survivability Conference and Exposition.
Vapnik, V. N. (2013). The Nature of Statistical Learning Theory. Springer; 2nd edición (Jun. 29, 2013). Springer. ISBN-13: 978-0387987804, ISBN-10: 0387987800.